


Like many research & intelligence firms, one of the things that ARtillery Intelligence does is market sizing. A few times per year, we go into isolation and bury ourselves deep in financial modeling. This takes the insights and observations we accumulate throughout the year and synthesizes them into hard numbers for the current and future spatial computing industry (methodology details here).
In covering spatial computing for eight years, our sector knowledge and perspective continue to expand. That occurs on several levels, including insights and access to insider information, all of which informs our forecast models and inputs. Further reinforcing that knowledge position, the daily rigors of editorial production at our sister publication, AR Insider, embolden our market insights. This also uncovers a steady flow of forecast inputs.
Beyond knowledge position and market-sizing processes, the focus of these forecasts likewise continues to evolve. Our first market forecast seven years ago examined AR, VR, and all their revenue subsegments (collectively, XR). Since then, we’ve evolved towards separate forecasts for headworn AR, mobile AR, and VR. Though all these areas share technical underpinnings, their nuanced market dynamics deserve deeper and focused treatment.
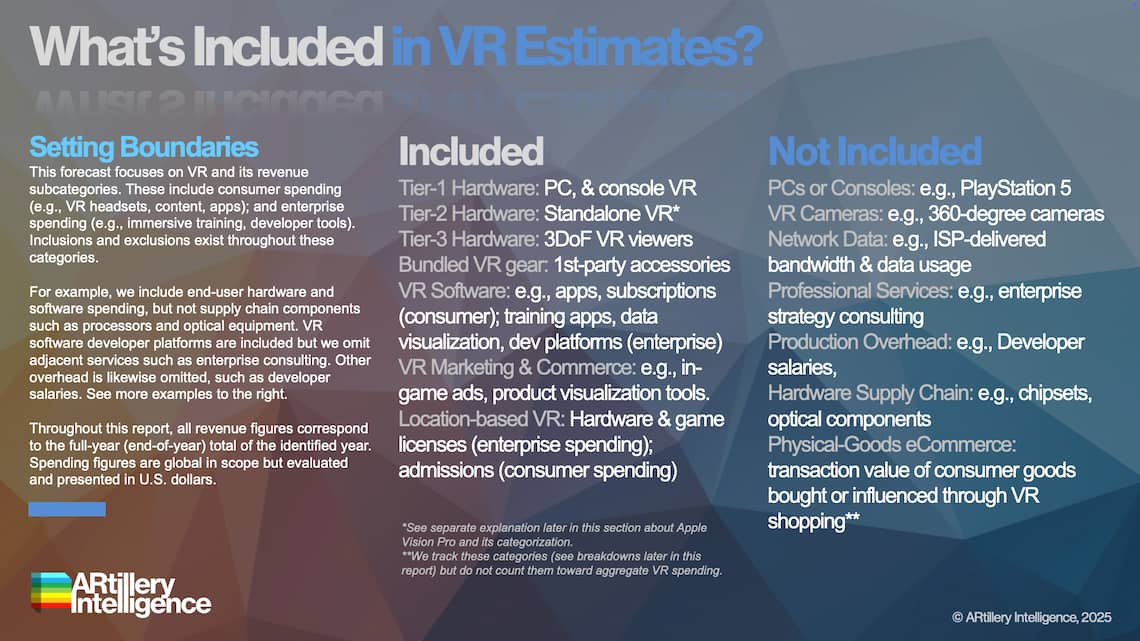
Accordingly, this report focuses on VR. Given its unique dynamics – in both technology and user adoption patterns – it compels its own focused analysis. This allows us to go deeper into key revenue sources like consumer (B2C), enterprise (B2B), and AR-enablement software (B2B2C). We did this in Q1 for mobile AR, Q2 for headworn AR, and we’ll do the same in Q4 for the collective XR market.
So what did we find out? Global VR revenue is projected to grow from $12.2 billion in 2024 to $18.9 billion in 2029, a 9.12 percent compound annual growth rate. This leads other XR sectors, such as mobile and headworn AR. Though VR continues to face market challenges and slow growth, it’s the most established of these XR subsegments.
Segmenting the above VR estimates, revenue is bisected by consumer and enterprise markets. Though consumer spending is somewhat strong –inheriting some demand and market dynamics from the robust gaming industry – enterprise spending has pulled ahead. This is mostly due to VR’s capacity for immersive training, which demonstrates favorable efficacy and efficiency. Starting with the former, VR’s visceral and experiential qualities elevate muscle memory and informational recall. As for efficiency, VR simulations drive cost reductions versus physical training methodologies, including equipment usage and travel costs to physically interact with training pros and settings. After all, atoms cost more than bits.
Companies ranging from Coca-Cola to Walmart to Bank of America have realized these advantages and invest in large-scale VR training programs. They’ve validated meaningful savings and greater effectiveness, which is a strong value proposition for adoptive enterprises that will grow in number.
Beyond consumer and enterprise segmentations, VR revenue can be bisected by hardware and software. For several years, hardware had a greater revenue share, as is often the case when new tech sectors emerge. But once a hardware installed base is established, software accelerates and eventually eclipses hardware spend. That happens as software builds on that larger installed base of hardware, and enjoys recurring revenue cycles (think: SaaS), that outpace hardware replacement cycles.
This historical pattern is precisely what we’ve seen in VR. And we are now at the stage when software revenue has eclipsed hardware in the aggregate. In addition to factors noted above, software spending is lifted by growing areas like consumer in-app-purchases (B2C), device management programs (B2B), and LBVR content/game licensing (B2B2C).
But it’s not all good news. As this report publishes at the end of Q3 2025, signs so far this year aren’t strong for consumer VR adoption. This troubling trend can be detected in primary signals that we track, such as Meta’s quarterly earnings. That attrition is partly due to market saturation for Meta’s latest hardware generation (Quest 3 and 3s). It’s also due to demand that has shifted from VR to emerging XR device classes such as screen-mirroring display glasses.
These competing devices from the likes of Xreal and VITURE offer large private screens for 2D entertainment like games & movies. Though VR can accomplish more dimensional experiences, these 2D experiences account for a meaningful share of VR usage.* And they’re now offered in a sleeker form factor. These screen-mirroring display glasses are tracked in our corresponding headworn-AR forecast.
So how do all these principles translate to revenue projections? That’s what we’ll quantify and qualify throughout this report…

The fastest and most cost-efficient way to get access to this report is by subscribing to ARtillery PRO (Startup tier or higher for forecast access). You can also purchase it a la carte.
ARtillery Intelligence follows disciplined best practices in market sizing and forecasting, developed and reinforced through its principles’ 20 years in research and intelligence in tech sectors. This includes the past 10 years covering AR & VR as a primary focus.
This report focuses on revenue projections in various sub-sectors and product areas. ARtillery Intelligence has built financial models that are customized to the specific dynamics and unit economics of each. These include variables like unit sales, company revenues, pricing trends, market trajectory, and several other micro and macro factors that ARtillery Intelligence tracks.
This approach primarily applies a bottom-up forecasting methodology, which is secondarily vetted against a top-down analysis. Together, confidence is achieved through triangulating revenues and projections in a disciplined way. More about ARtillery Intelligence’s market-sizing methodology can be seen here and more on its credentials can be seen here.


Unless specified in its stock ownership disclosures, ARtillery Intelligence has no financial stake in the companies mentioned in its reports. The production of this report likewise wasn’t commissioned. With all market sizing, ARtillery Intelligence remains independent of players and practitioners in the sectors it covers, thus mitigating bias in industry revenue calculations and projections. ARtillery Intelligence’s disclosures, stock ownership, and ethics policy can be seen in full here.
Checkout easily and securely.

Ask us anything
Credentials & context