ARtillery Intelligence publishes several reports based on original market-sizing and revenue projections. Beyond monthly narrative reports that draw upon that data, we publish extensive data-centric reports. In all cases, key questions are how do we come up with these figures? and What’s included?
It’s important to specify this because there’s such variance across industry projections due to differences in methodology, and what’s being tracked. In a world where industry watchers get a reputation for “calling it in,” it’s important to disclose methodologies to demonstrate diligence in market sizing.
It’s all about grounded calculations.
ARtillery Intelligence follows disciplined best practices in market sizing and forecasting, developed and reinforced through its principles’ 20 years in research and intelligence in the tech sector. This includes the past 7 years covering spatial computing as a main focus. Each market-sizing or forecasting deliverable is different in its composition and inclusions, which are specified in each case (example). Generally speaking, Artillery Intelligence primarily applies the bottom-up approach, followed by the top-down method as a “gut-check.”
Bottom-Up (primary)
The bottom-up forecasting methodology requires building financial models that reflect the dynamics and unit economics of sectors being measured. This includes variables like unit sales, pricing trends, individual company performances, and several other micro factors that ARtillery Intelligence tracks. Because there are often sub-sectors that comprise an overall industry (e.g. enterprise and consumer AR), the bottom-up method requires unique models for each segment that reflect their unique unit economics and revenue drivers.
Top-Down (secondary)
The top-down methodology takes a more macro approach. It looks at influential market factors that inform industry revenue growth and trajectory. This can include comparable/historic industry growth rates and other macro factors, such as share of GDP. This approach is useful to validate, challenge and/or gain additional levels of confidence after executing the bottom-up approach. Generally, that is our order of operations.
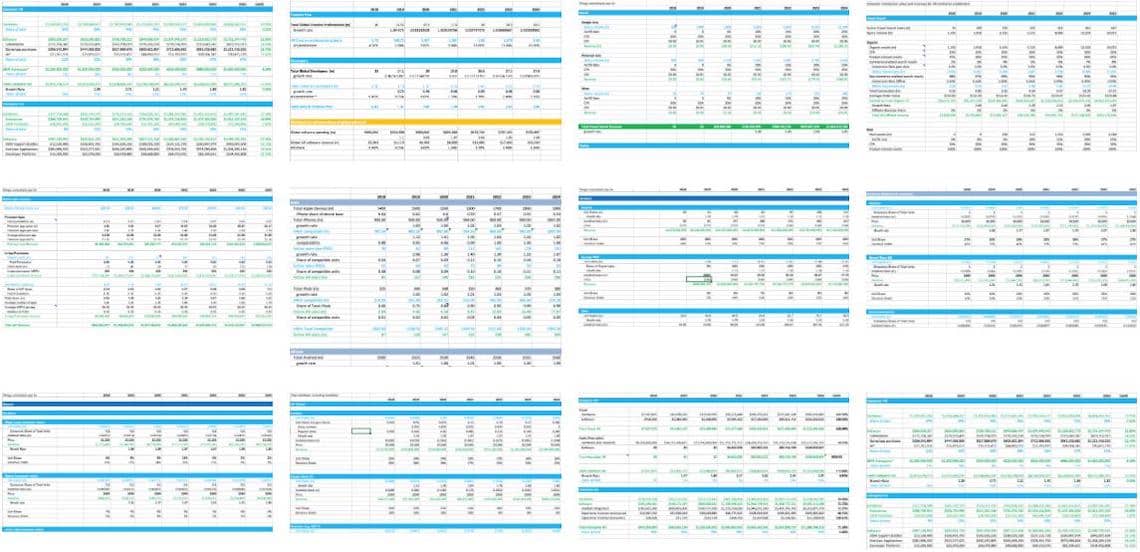
Together, confidence is achieved by triangulating market size in a disciplined way. It all comes together in a forecast model with several spreadsheet tabs and thousands of active cells. More about ARtillery Intelligence principles’ market-sizing history and credentials can be seen here.


Revenue inclusions sway the outcome.
One of the biggest factors that impacts a given forecast’s outcome is what revenue sources are included. Some firms include things that others don’t, which can sway the outcome by billions of dollars.
For instance, some firms count the transaction value of products bought through AR interfaces as “AR revenue.” This would be the $2000 you pay for a couch bought using the IKEA Place app to visualize the item in your living room. We don’t count this as AR revenue, but we do count software elsewhere in the value chain, such as AR experience creation; or revenues for startups that enable AR commerce. That can take form in licensing, SaaS or affiliate commerce revenue.
Decisions like these that analyst firms make about what to include (or not include) are perfectly okay. We respect those decisions, as long as they’re specified clearly. Firms engaged in XR market sizing mostly do a good job communicating this. For you, knowing what a given forecast includes should be considered before taking strategic guidance away from it.
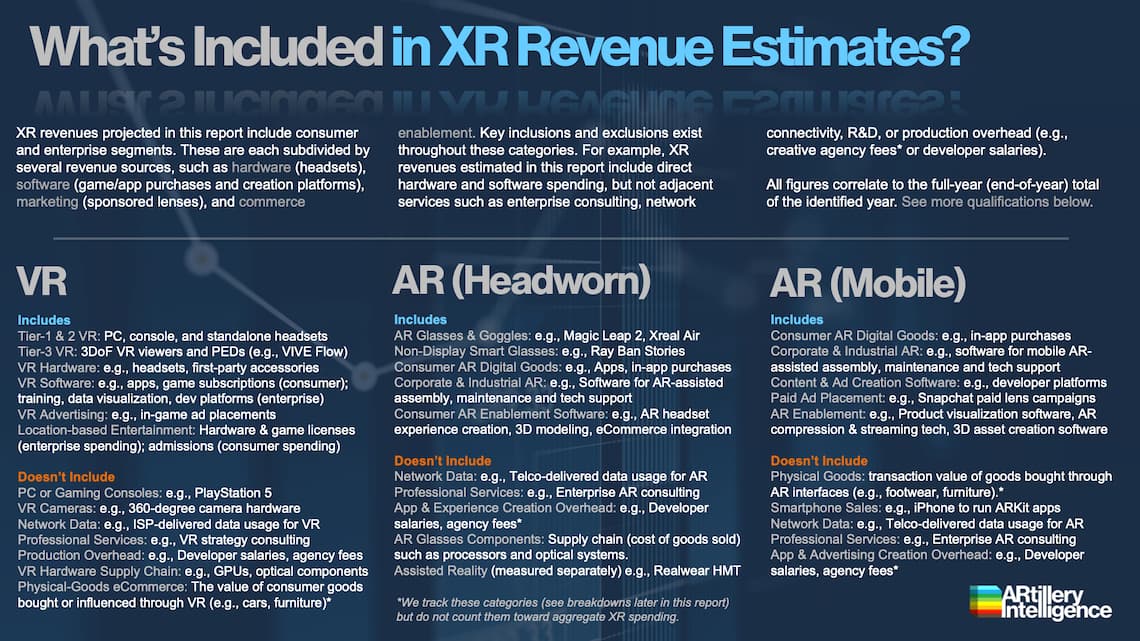
With that backdrop, our responsibility to you is to clearly specify everything that is included in our market-sizing reports. This is done as a matter of protocol for every forecast we produce – including preface materials and footnotes on a per-slide basis. An example is below from a recent forecast, and we’re open to additional questions.

Triangulating unknown quantities
One ongoing challenge in market sizing is data availability. It’s all about piecing together clues to extrapolate things like unit sales and revenues. In mature markets like smartphones, hardware players disclose figures — especially if publicly traded — but it’s a lot quieter on the early-stage front.

That’s the case with VR for example, which becomes an exercise in gathering hints in perpetual market-sizing mode. Sometimes there are exceptions like Sony’s disclosures for PSVR sales. Otherwise, it requires detective work to find reliable inputs for the financial models outlined above.
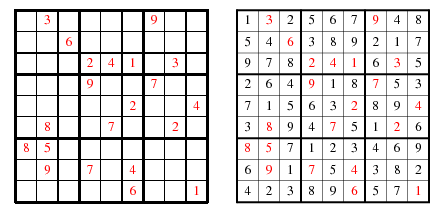
We often compare this to a Sudoku board. It’s similarly about logically devising unknown quantities using known ones. For example, along with primary research and insider discussions, things like hardware sales can be extrapolated using announced software sales in tandem with pricing and ARPU data. Here’s an example…
The Sudoku approach isn’t a panacea, but rather a method pulled from a larger toolbox. In fact, having several approaches can stress-test and gut-check a financial model. It’s about coming at it from many different angles to gain validation and levels of confidence.
Another analogy this brings to mind is our days (many years ago) in high school AP calculus. It was the ultimate form of validation to apply different methods that arrive at the same solution. It works even better with multiple double-blind participants. We live by this principle.
The other lesson from those days is to show your work… getting back to the principles above about well-communicated methodologies and inclusions. On that note, though our financial model is highly proprietary, we’re always eager to invoke individual sections to show our work.
Another question that follows the Sudoku analogy is how do we get our hands on the known quantities to even begin the exercise? The answer is lots of time and rigor. There are clues all around us in industry happenings, which we spend several hours per day collecting and talking to industry insiders.
One factor that propels this is our sister publication AR Insider. With years of prior experience as journalists, we’ve become conditioned to the cadence of daily reporting and publishing. As industry analysts, we’ve since learned that this is also the ultimate way to achieve deep knowledge and retention of any topic.
Moreover, the discipline of daily publishing at AR Insider exposes us to an immense amount of information, while press credentials provide deeper access. Our focused attention on daily industry happenings is then retained by indexing knowledge and data through tag-based browser extensions from Evernote and Google Keep.
Then, when sitting down for the intensive forecasting process, that indexed base of tagged and filtered data starts us off with a wealth of inputs for our financial model. These are the known quantities of the Sudoku board, ensuring that we start the endeavor with a firm foundation.
Speaking of a firm foundation, our biggest priority when calculating market sizes is confidence and structural integrity in base-year figures. The elephant in the room with forecasting is that outer-year projections mostly rely on educated assumptions, revenue momentum, and historical patterns.
But the base year figures have no excuses. They must be accurate, well-backed, and fire-tested. The best chance of ensuring accuracy and validity in building out future-year projections is to do so from a strong foundation of current and past-year precision. That is our foundational principle.
More color on our method
We’re all about quality standards.
ARtillery Intelligence has no financial stake in the companies mentioned in its reports, unless specified in footnotes and endnotes. With respect to market sizing, ARtillery remains independent of players and practitioners in the sectors it covers, thus mitigating bias in industry revenue calculations and projections. Disclosure and ethics policy can be seen in full here.


