


Like many research & intelligence firms, one of the things that ARtillery Intelligence does is market sizing. A few times per year, we go into isolation and bury ourselves deep in financial modeling. This exercise takes the insights and observations we accumulate throughout the year and synthesizes them into hard numbers for the current and future spatial computing industry (methodology details here).
In covering spatial computing for eight years, our sector knowledge base and perspective continue to expand. That occurs on several levels, including insight and access to insider information, all of which informs our forecast models and inputs. Further reinforcing that knowledge position, the daily rigors of editorial production at our sister publication, AR Insider, emboldens our market insights. It also offers an invaluable asset for market-sizing work: access.
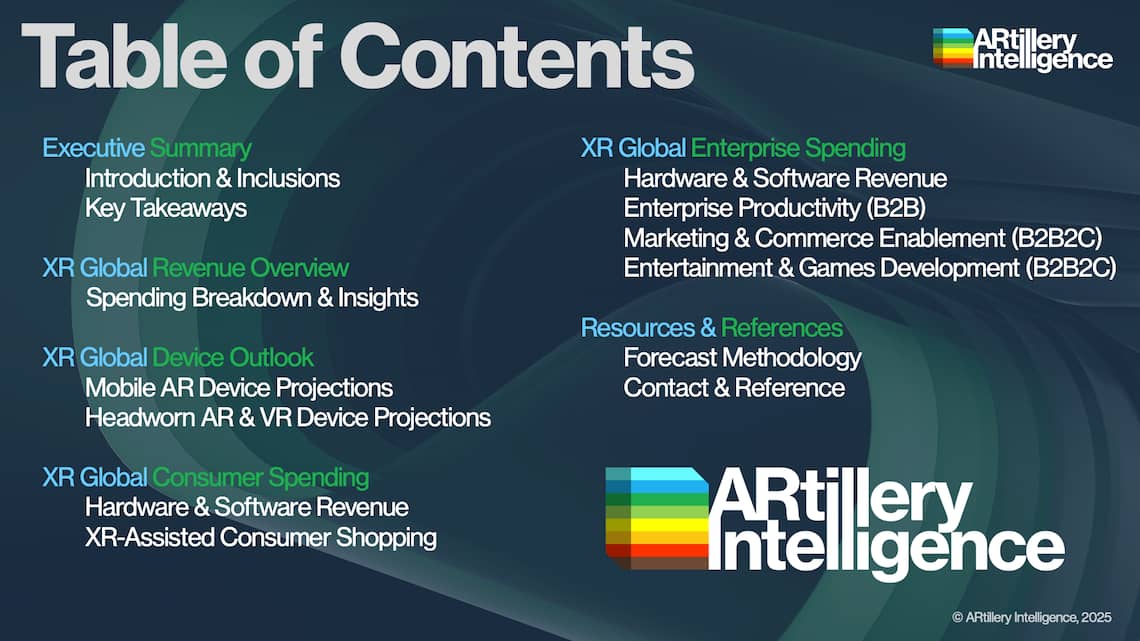
Beyond a knowledge position and market-sizing process, the focus of these forecasts likewise continues to evolve. Our first market forecast eight years ago examined AR, VR, and all their revenue subsegments (collectively, XR). More recently, we began to produce separate forecasts for headworn
and mobile AR, as well as VR. Though all three share technical underpinnings, their nuanced market dynamics deserve deeper and focused treatment.
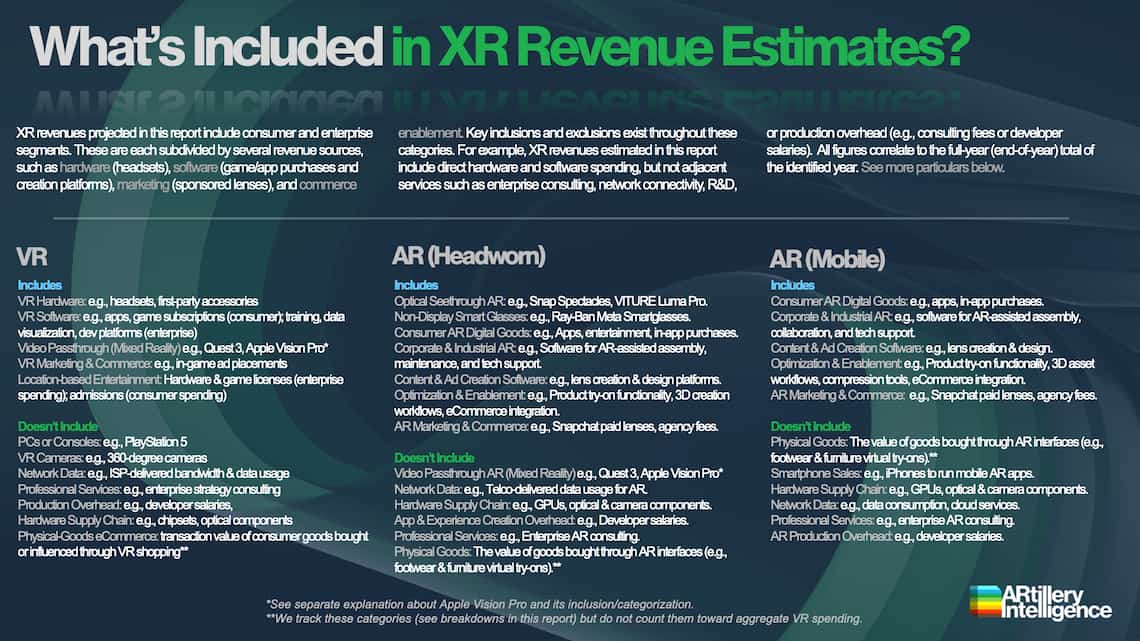
But now the pendulum has swung back in the other direction. In addition to those focused drill-downs into spatial computing subsegments, we’re returning to a comprehensive XR forecast. Why? The idea is to reveal insights about how these interrelated sectors contrast and converge. For example, what’s the market opportunity for supporting tech (e.g., creation platforms) that span AR and VR? And what’s the comparative hardware penetration and device sales outlook across these form factors? This combined XR forecast allows us to tackle such questions.
So what did we find out? Starting at the top, XR revenue will grow from $24.8 billion in 2024 to $57.6 billion in 2029. Among XR form factors, VR leads with $13.5 billion in 2025, followed by mobile AR ($10.7 billion) and headworn AR ($4.6 billion).
Taking these one at a time – in the order of revenue share – VR’s lead is owed to its more established and technologically-mature state, relative to AR. It’s also propelled by Meta’s loss-leader investments to gain early market share and build a network effect. This was accelerated by Quest 3 and its younger sibling, Quest 3s, which both represent a new standard in VR devices that feature high-resolution color passthrough cameras for mixed reality. And the price is right. But though VR leads today, its sales are slowing as headworn AR – particularly flat AR and non-display smart glasses – ramps up (more on that in a bit).
Moving on to mobile AR, it has a healthy installed base of hardware as it piggybacks on global smartphone saturation. But that installed base doesn’t always translate to revenue. For example, consumer spending in mobile AR is relatively low. With the exception of in-app purchases in Pokémon Go (which are sustaining to a degree) and Snap’s new Lens+ subscription, most consumers aren’t yet paying for AR experiences. So if not from consumers, where is money being made in mobile AR? The short answer is B2B2C. This involves brand spending to create AR experiences for their customers. It includes AR marketing, commerce enablement, and experience creation software. There’s also a fair amount of B2B revenue in mobile AR, such as visually-guided productivity in industrial and corporate settings.
On to headworn AR, there continues to be ample anticipation for full-featured dimensional AR glasses (see device classes and definitions later in this section). But there’s also a looming reality check, given their technological and practical challenges. These barriers include cost, bulk and cultural resistance. With the exception of standouts like Snap’s upcoming consumer spectacles, these dimensional-AR challenges drive ‘lighter’ approaches.
For example, flat AR is inferior to dimensional AR in its visual UX, but can still be valuable in utilities such as messaging, POV viewfinders, and other forms of augmentation. These are experientially meaningful, even if graphically suboptimal. And one factor has unlocked value and functionality in these flat-AR approaches: AI. By making flat AR situationally intelligent, it brings it from underwhelming to utilitarian.
Speaking of which, similar factors define non-display AI glasses. Led by Ray-Ban Meta smart glasses (RBMS), the toned-down UX noted above is taken to another level by sidestepping visuals altogether. Moreover, this tradeoff of utility and style for visuals has been validated. The market has spoken… to the tune of 5 million+ cumulative units sold for RBMS. Sales momentum is also strong, while other players have begun to chase these validated demand signals. These include the emerging Android XR ecosystem, which could do for XR – across device classes – what Android did for the mobile ecosystem 15 years ago.
The bottom line is that after about a decade of ups and downs, the XR ecosystem could be facing another inflection. The difference this time is that the technology is more stable, and the go-to-market strategies are sounder.

The fastest and most cost-efficient way to get access to this report is by subscribing to ARtillery PRO (Startup tier or higher for forecast access). You can also purchase it a la carte.
ARtillery Intelligence follows disciplined best practices in market sizing and forecasting, developed and reinforced through its principles’ 20 years in research and intelligence in tech sectors. This includes the past 10 years covering AR & VR as a primary focus.
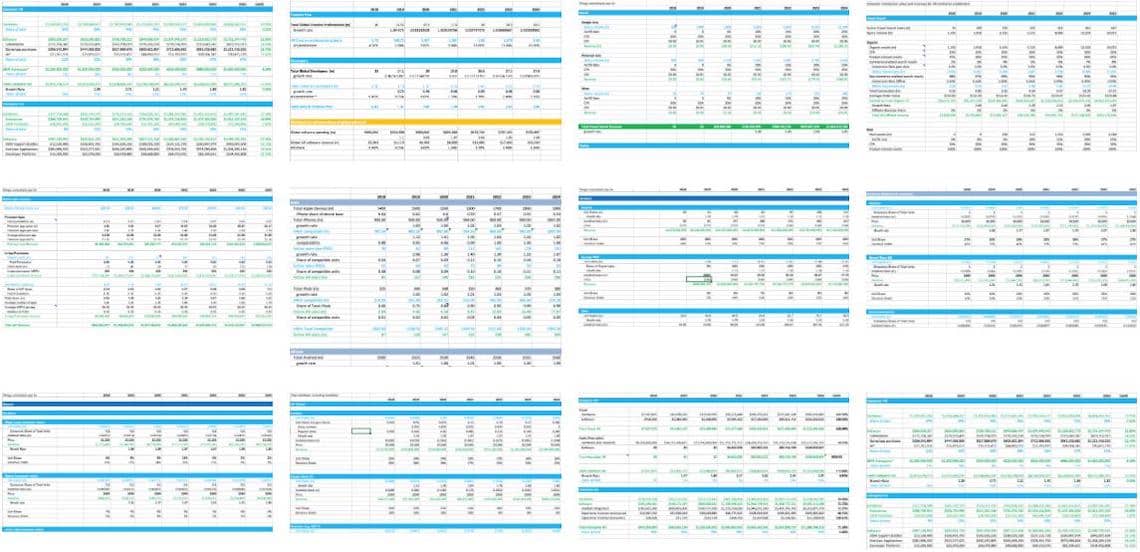
This report focuses on revenue projections in various sub-sectors and product areas. ARtillery Intelligence has built financial models that are customized to the specific dynamics and unit economics of each. These include variables like unit sales, company revenues, pricing trends, market trajectory, and several other micro and macro factors that ARtillery Intelligence tracks.
This approach primarily applies a bottom-up forecasting methodology, which is secondarily vetted against a top-down analysis. Together, confidence is achieved through triangulating revenues and projections in a disciplined way. More about ARtillery Intelligence’s market-sizing methodology can be seen here and more on its credentials can be seen here.


Unless specified in its stock ownership disclosures, ARtillery Intelligence has no financial stake in the companies mentioned in its reports. The production of this report likewise wasn’t commissioned. With all market sizing, ARtillery Intelligence remains independent of players and practitioners in the sectors it covers, thus mitigating bias in industry revenue calculations and projections. ARtillery Intelligence’s disclosures, stock ownership, and ethics policy can be seen in full here.
Checkout easily and securely.

Ask us anything
Credentials & context