XR Global Revenue Forecast: 2022-2027


Like many research & intelligence firms, one of the things that ARtillery Intelligence does is market sizing. A few times per year, we go into isolation and bury ourselves deep in financial modeling. This exercise takes the insights and observations we accumulate throughout the year and synthesizes them into hard numbers for the current and future spatial computing industry.
In covering spatial computing for eight years, our sector knowledge base and perspective continue to expand. That occurs on several levels, including insight and access to insider information, all of which informs our forecast models and inputs. Further reinforcing that knowledge position, the daily rigors of editorial production at our sister publication AR Insider emboldens our market insights. It also offers an invaluable asset for market-sizing work: access.
Beyond a knowledge position and market-sizing process, the focus of these forecasts likewise continues to evolve. Our first market forecast six years ago examined AR, VR, and all their revenue subsegments (collectively, XR). More recently, we began to produce separate forecasts* for headworn and mobile AR, as well as VR. Though all three share technical underpinnings, their nuanced market dynamics deserve deeper and focused treatment.
But now the pendulum has swung back in the other direction. In addition to those focused drill-downs into spatial computing subsegments, we’re returning to a comprehensive XR forecast. Why? The idea is to reveal insights about how these interrelated sectors contrast and converge. For example, what’s the market opportunity for supporting tech (e.g., creation platforms) that span AR and VR? And what’s the comparative hardware penetration and device sales outlook across these form factors? This combined XR forecast allows us to tackle such questions.
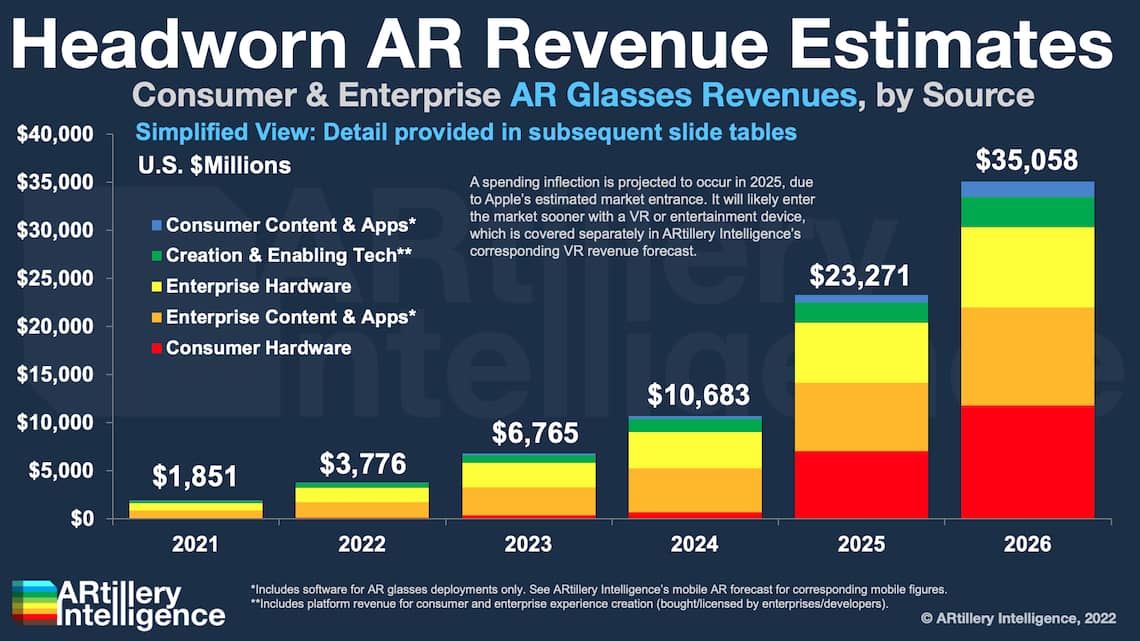
So what did we find out? Starting at the top, XR revenue will grow from $22.7 billion in 2022 to $70.1 billion in 2027. Among XR form factors, mobile AR leads with $14.8 billion in 2023, followed by VR ($10.7 billion) and headworn AR ($2.8 billion). Here, mobile AR’s lead is owed to piggybacking on an installed base of 3 billion+ smartphones.
But that installed base doesn’t always translate to revenue. For example, consumer spending in mobile AR is relatively low. Most of that spending is for digital goods, such as in-app purchases in Pokémon Go. Though the game is still going strong, it’s a bit of an outlier as most consumers aren’t paying for AR experiences at this stage.
So if not from consumers, where is money being made in mobile AR? The short answer is B2B2C. This involves brand spending to create AR experiences for their customers or potential customers. It includes AR marketing, commerce enablement, and experience creation software.
Moving on to VR, it’s a segment where most revenue comes from consumers. The big story there continues to be Meta’s loss-leader investments to gain early market share and build a network effect. This was most recently accelerated by Quest 3, which represents a new standard in VR headsets that feature high-resolution color passthrough cameras – a bridge to Meta’s headworn AR ambitions.
That brings us to headworn AR, where there’s ample anticipation for AR glasses in the tech press and broader culture… but also a looming reality check. Futuristic visions of pervasive all-day glasses hit a brick wall when considering technological requirements. Not only are these requirements intense – involving nuanced optical and display systems – but achieving stylistic viability adds another layer of complexity. The bottom line is that ubiquitous AR glasses are more of a 2030s reality than a 2024 one. Meanwhile, we see worthwhile approaches toward ”lite AR” in terms of stylistically-viable devices like Meta Ray Ban Smart Glasses (AI-driven audio AR), and Xreal Air 2 (lean-back immersive entertainment).
At the other end of the experiential spectrum is Apple Vision Pro. All eyes are on the device due to Apple’s track record in mainstreaming emerging tech through its signature halo effect. Estimated unit sales will be low (224,000) in early years due to the device’s price tag. But it could gradually penetrate further, seeing growth curves that mirror slow-start Apple wearables historically. This will happen as the device slims down over several generations… in both price and in bulk.
So how will we reach those milestones in the next five years? And what subsectors of the spatial spectrum are driving that growth? We tackle these questions through numbers & narratives in the coming pages.

The fastest and most cost-efficient way to get access to this report is by subscribing to ARtillery PRO (Startup tier or higher for forecast access). You can also purchase it a la carte.
ARtillery Intelligence follows disciplined best practices in market sizing and forecasting, developed and reinforced through its principles’ 18 years in research and intelligence in tech sectors. This includes the past 8 years covering AR & VR as a primary focus.
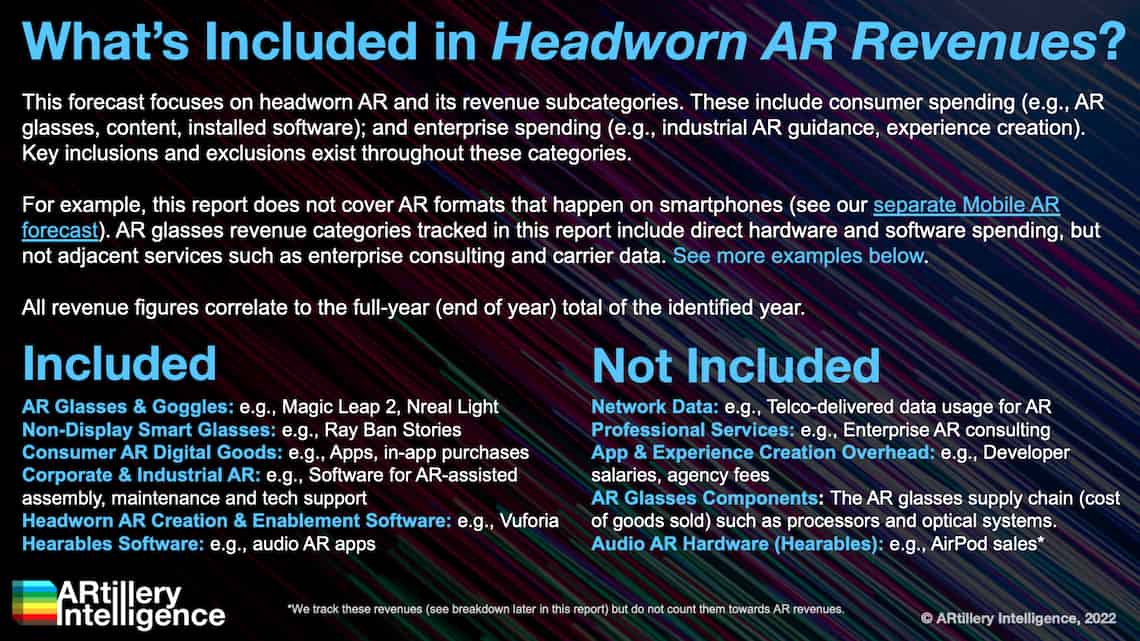
This report focuses on revenue projections in various sub-sectors and product areas. ARtillery Intelligence has built financial models that are customized to the specific dynamics and unit economics of each. These include variables like unit sales, company revenues, pricing trends, market trajectory, and several other micro and macro factors that ARtillery Intelligence tracks.
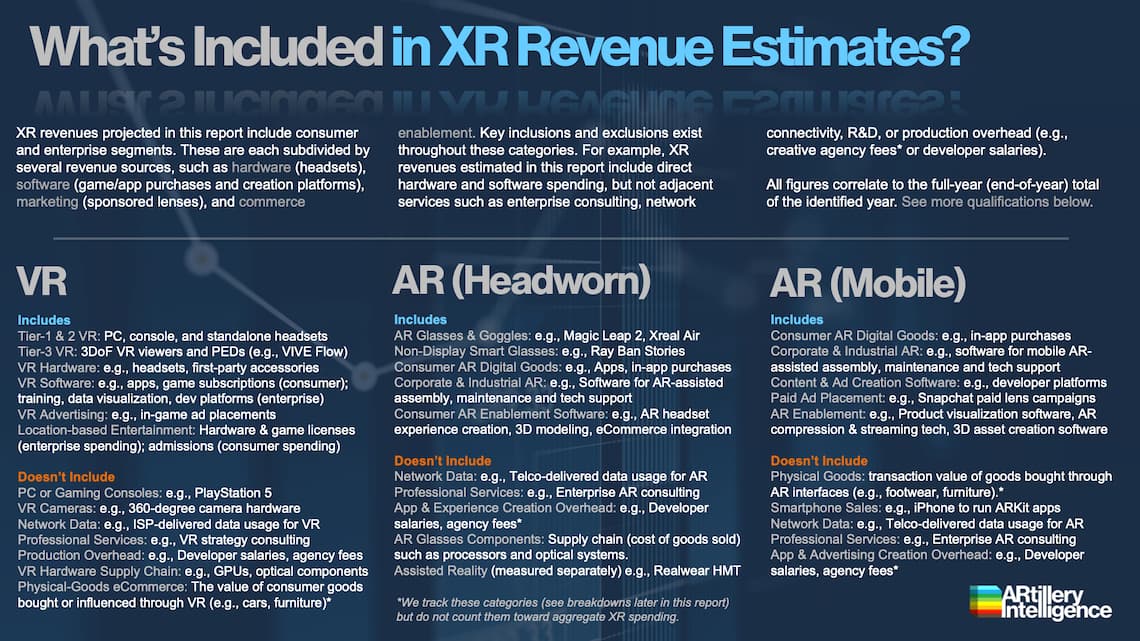
This approach primarily applies a bottom-up forecasting methodology, which is secondarily vetted against a top-down analysis. Together, confidence is achieved through triangulating revenues and projections in a disciplined way. For more information on what’s included and not included in the forecast (a key consideration when evaluating the findings) see the next slide.
More about ARtillery Intelligence’s market-sizing methodology can be seen here and more on its credentials can be seen here.


Unless specified in its stock ownership disclosures, ARtillery Intelligence has no financial stake in the companies mentioned in its reports. The production of this report likewise wasn’t commissioned. With all market sizing, ARtillery Intelligence remains independent of players and practitioners in the sectors it covers, thus mitigating bias in industry revenue calculations and projections. ARtillery Intelligence’s disclosures, stock ownership, and ethics policy can be seen in full here.
Checkout easily and securely.

Ask us anything
Credentials & context