Page 3 of 9

Enterprise AR: Best Practices & Case Studies, Volume 3


Executive Summary

Though we spend ample time examining consumer-based AR endpoints, considerable adoption and impact are demonstrated today in the enterprise.

This takes many forms including data visualization in corporate settings, or software to create customer-facing AR experiences for brands (B2B2C). ARtillery Intelligence’s market sizing factors all these spending categories. But the greatest area of enterprise AR impact today is realized in industrial settings.

These use cases include AR visualization to support assembly and maintenance in manufacturing contexts. It can also include visual guidance (in both mobile and headwork form factors) for IT field support. The idea is that AR’s line-of-sight orientation can make front-line workers more intelligent and empowered. Compared to the “mental mapping” they do with 2D instructions, visual support makes them more effective.

This effectiveness results from AR-guided speed, accuracy, and safety. These micro efficiencies add up to worthwhile bottom-line impact when implemented at scale in industrial operations. Macro benefits meanwhile include lessening job strain and the “skills gap,” which can help preserve institutional knowledge.

For example, AR leader PTC reports up to 40 percent improvements in new employee productivity, 30 percent greater first-time fix rates, 50 percent reductions in training costs, and 25 percent reductions in materials scrap.

But it’s not all good news. Though all these benefits are valid, it’s challenging to get to the point of realizing them. Practical and logistical barriers loom, including organizational inertia, politics, change management, and fear of new technology among front-line workers.

Sticking with some of those organizational hurdles, the biggest symptom is the dreaded “pilot purgatory.” As its name suggests, this is when AR is adopted at the pilot stage, but never progresses to full deployment. It’s one of industrial AR’s biggest pain points today.

ARtillery Intelligence has identified sources and solution areas for pilot purgatory. Known as the “3 Ps,” they include people, product, and process. These are the areas where effective AR implementation strategies should focus (explored later in the report).

With that backdrop, we continue the narrative in this report on enterprise AR, including new ARtillery Intelligence market sizing data. Moreover, we devote the bulk of this report to “show rather than tell.” We’ll do this through case studies that demonstrate enterprise AR’s ROI potential and best practices.

To adequately represent these factors, we’ve reached out to leading enterprise AR players to collect their top case studies. We’ve then relayed these through our own lens and analytical rigor. We’ve prioritized case studies that have quantifiable results, actionable takeaways, and a wide range of business verticals.

The goal in all the above is to reveal the why and how of enterprise AR. Through the lens of industry best practices, why should enterprises invest in AR? And how should it be implemented? The name of the game is to set up enterprise AR to succeed by deploying it from a place of confidence and knowledge.


Price: $999

The fastest and most cost-efficient way to get access to this report is by subscribing to ARtillery PRO. You can also purchase it a la carte.


Companion Video


Methodology

This report highlights ARtillery Intelligence viewpoints, gathered from its daily in-depth market coverage. To support narratives, data are cited throughout the report. These include ARtillery Intelligence’s original data, as well as that of third parties. Sources are linked or attributed in each case.

For market sizing and forecasting, ARtillery Intelligence follows disciplined best practices, developed and reinforced through its principles’ 17 years in tech-sector research and intelligence. This includes the past 7 years covering AR & VR exclusively, as seen in research reports and daily reporting.

This approach primarily applies a bottom-up forecasting analysis, secondarily vetted against a top-down analysis. Together, confidence is achieved through triangulating figures in a disciplined way. More about our methodology can be seen here, and market-sizing credentials can be seen here.

Disclosure & Ethics Statement

Unless specified in its stock ownership disclosures, ARtillery Intelligence has no financial stake in the companies mentioned in its reports. The production of this report likewise wasn’t commissioned. With all market sizing, ARtillery Intelligence remains independent of players and practitioners in the sectors it covers, thus mitigating bias in industry revenue calculations and projections. ARtillery Intelligence’s disclosures, stock ownership, and ethics policy can be seen in full here.


Purchase Report

Checkout easily and securely.


Questions

Ask us anything

Error: Contact form not found.


Reference

Credentials & context

Headworn AR Global Revenue Forecast: 2022-2027


Executive Summary

Like many research & intelligence firms, one of the things that ARtillery Intelligence does is market sizing. A few times per year, we go into isolation and bury ourselves deep in financial modeling. This takes the insights and observations we accumulate throughout the year and synthesizes them into hard numbers for the current and future spatial computing industry.

The latest such effort zeroes in on Headworn AR, which is projected to grow from $2.32 billion in 2022 to $35.26 billion in 2027. This trails other XR sectors we track, such as mobile AR and VR, as they’re at more advanced stages. Though headworn is AR’s endgame, it’s underdeveloped today, due to its highly-advanced technological requirements.

Meanwhile, there continues to be ample anticipation for AR glasses in the tech press and broader culture… but also a looming reality check. Futuristic visions of pervasive all-day glasses hit a brick wall when considering technological requirements. Not only are these requirements intense – involving nuanced optical and display systems – but achieving stylistic viability adds another layer of complexity. Approaching ubiquity is more of a 2030 reality than a 2023 one. But if anything could accelerate that, it’s immense R&D spending* from Apple, Meta, Google. and Microsoft.

Zeroing in on the most influential of these players, Apple will advance AR adoption with its “halo effect,” flowing from the Vision Pro. Its market impact will take a few years, due to the device’s price point, but it will be influential in bringing AR to a wider swath of mainstream enterprises and consumers (in that order). On a technical note, though its AR capabilities involve passthrough cameras (like Quest Pro, which is tracked in our VR forecast), its primary use case is AR. When putting on the device, the first thing users see is the world around them. So we’ll cover it in this report.

As all of that materializes, headworn AR has already found traction by helping industrial and corporate enterprises boost productivity. For example, it helps IT services field reps operate with greater speed and effectiveness through line-of-sight guidance and remote support.

Speaking of enterprise adoption, it not only happens in a B2B sense but with B2B2C. We’re talking consumer endpoints such as games, entertainment, marketing, and commerce. The technology to create and support these functions is bought by developers and brands who lean into AR as an interactive touchpoint with customers or marketing targets. This principle is already playing out in mobile AR, such as branded AR lenses, but will follow in headworn AR as the field evolves.

We’re not there yet, due to low hardware penetration, but we’ll prepare for such market opportunities by beginning to project B2B2C spend in this forecast. With AR hardware from Apple, Meta and others on the horizon, B2B2C revenue models could develop in the next few years.

So how do all these principles translate to revenue projections? That’s what we’ll quantify and qualify throughout this report…


Price: $1999

The fastest and most cost-efficient way to get access to this report is by subscribing to ARtillery PRO (Startup tier or higher for forecast access). You can also purchase it a la carte.


Companion Video


Methodology

ARtillery Intelligence follows disciplined best practices in market sizing and forecasting, developed and reinforced through its principles’ 17 years in research and intelligence in tech sectors. This includes the past 7 years covering AR & VR as a primary focus.

This report focuses on headworn AR revenue projections in various sub-sectors and product areas. ARtillery Intelligence has built financial models that are customized to the specific dynamics and unit economics of each. These include variables like unit sales, company revenues, pricing trends, market trajectory and several other micro and macro factors that ARtillery Intelligence tracks.

This approach primarily applies a bottom-up forecasting methodology, which is secondarily vetted against a top-down analysis. Together, confidence is achieved through triangulating revenues and projections in a disciplined way. For more information on what’s included and not included in the forecast (a key consideration when evaluating the findings) see the next slide.

More about ARtillery Intelligence’s market-sizing methodology can be seen here and more on its credentials can be seen here.

Disclosure & Ethics Statement

Unless specified in its stock ownership disclosures, ARtillery Intelligence has no financial stake in the companies mentioned in its reports. The production of this report likewise wasn’t commissioned. With all market sizing, ARtillery Intelligence remains independent of players and practitioners in the sectors it covers, thus mitigating bias in industry revenue calculations and projections. ARtillery Intelligence’s disclosures, stock ownership, and ethics policy can be seen in full here.


Purchase Report

Checkout easily and securely.


Questions

Ask us anything

Error: Contact form not found.


Reference

Credentials & context

Mobile AR Usage & Consumer Attitudes, Wave 6


Executive Summary

How do consumers feel about mobile AR? Who’s using it? How often? And what do they want to see next? Perhaps more importantly, what are non-users’ reasons for disinterest? And how should app developers build mobile AR experiences accordingly?

These are the questions we set out to answer. Working closely with Thrive Analytics, ARtillery Intelligence wrote questions to be fielded to more than 75,000 U.S. adults through Thrive’s established consumer survey engine. As the sixth wave of this mobile AR research, results are in and we’ve synthesized the takeaways throughout this report.

This follows several ARtillery Intelligence monthly reports that examine various segments of, and developing use cases for, consumer AR. Now a deeper view into real consumer usage and attitudes validates those narratives while providing new dimension on mobile AR strategies and opportunities.

So what did we find out? At a high level, mobile AR usage has grown to 32 percent of U.S. adults. Many of these users experience AR through AR apps, such as those built on Apple’s ARKit and Google’s ARCore. But there’s greater engagement with lower-friction experiences such as “AR-as-a-feature.”

Mobile AR users also appear active and engaged, with 46 percent reporting that they use it at least weekly. The top app category is gaming, which we attribute to Pokémon Go’s sustained traction. But other categories such as AR shopping and visual search continue to make headway. Mobile AR users also indicate high levels of satisfaction.

Beyond the positive results and demand signals outlined in on the previous page, there are negative signs and areas for improvement. For example, non-mobile AR users report low likelihood of adopting, and an explicit lack of interest in the technology.

This disparity between current-user satisfaction and non-user disinterest continues to underscore a key challenge for AR: you need to experience it to see its benefits. But there’s little motivation for non-users to do so. This creates a classic “chicken & egg” dilemma that represents a core marketing challenge for AR.

Put another way, AR’s highly-visual and immersive format is a double-edged sword. It can create strong affinities and high engagement levels. But the visceral nature of its experience can’t be communicated to prospective users through traditional marketing, such as ad copy or even video.

The same chicken & egg challenge was uncovered in the corresponding VR consumer research that we published last month. This makes it a common challenge for immersive tech, though AR is relatively advantaged by mobile ubiquity. Still, it will take time and acclimation before AR reaches a more meaningful share of the population. This will require patience.

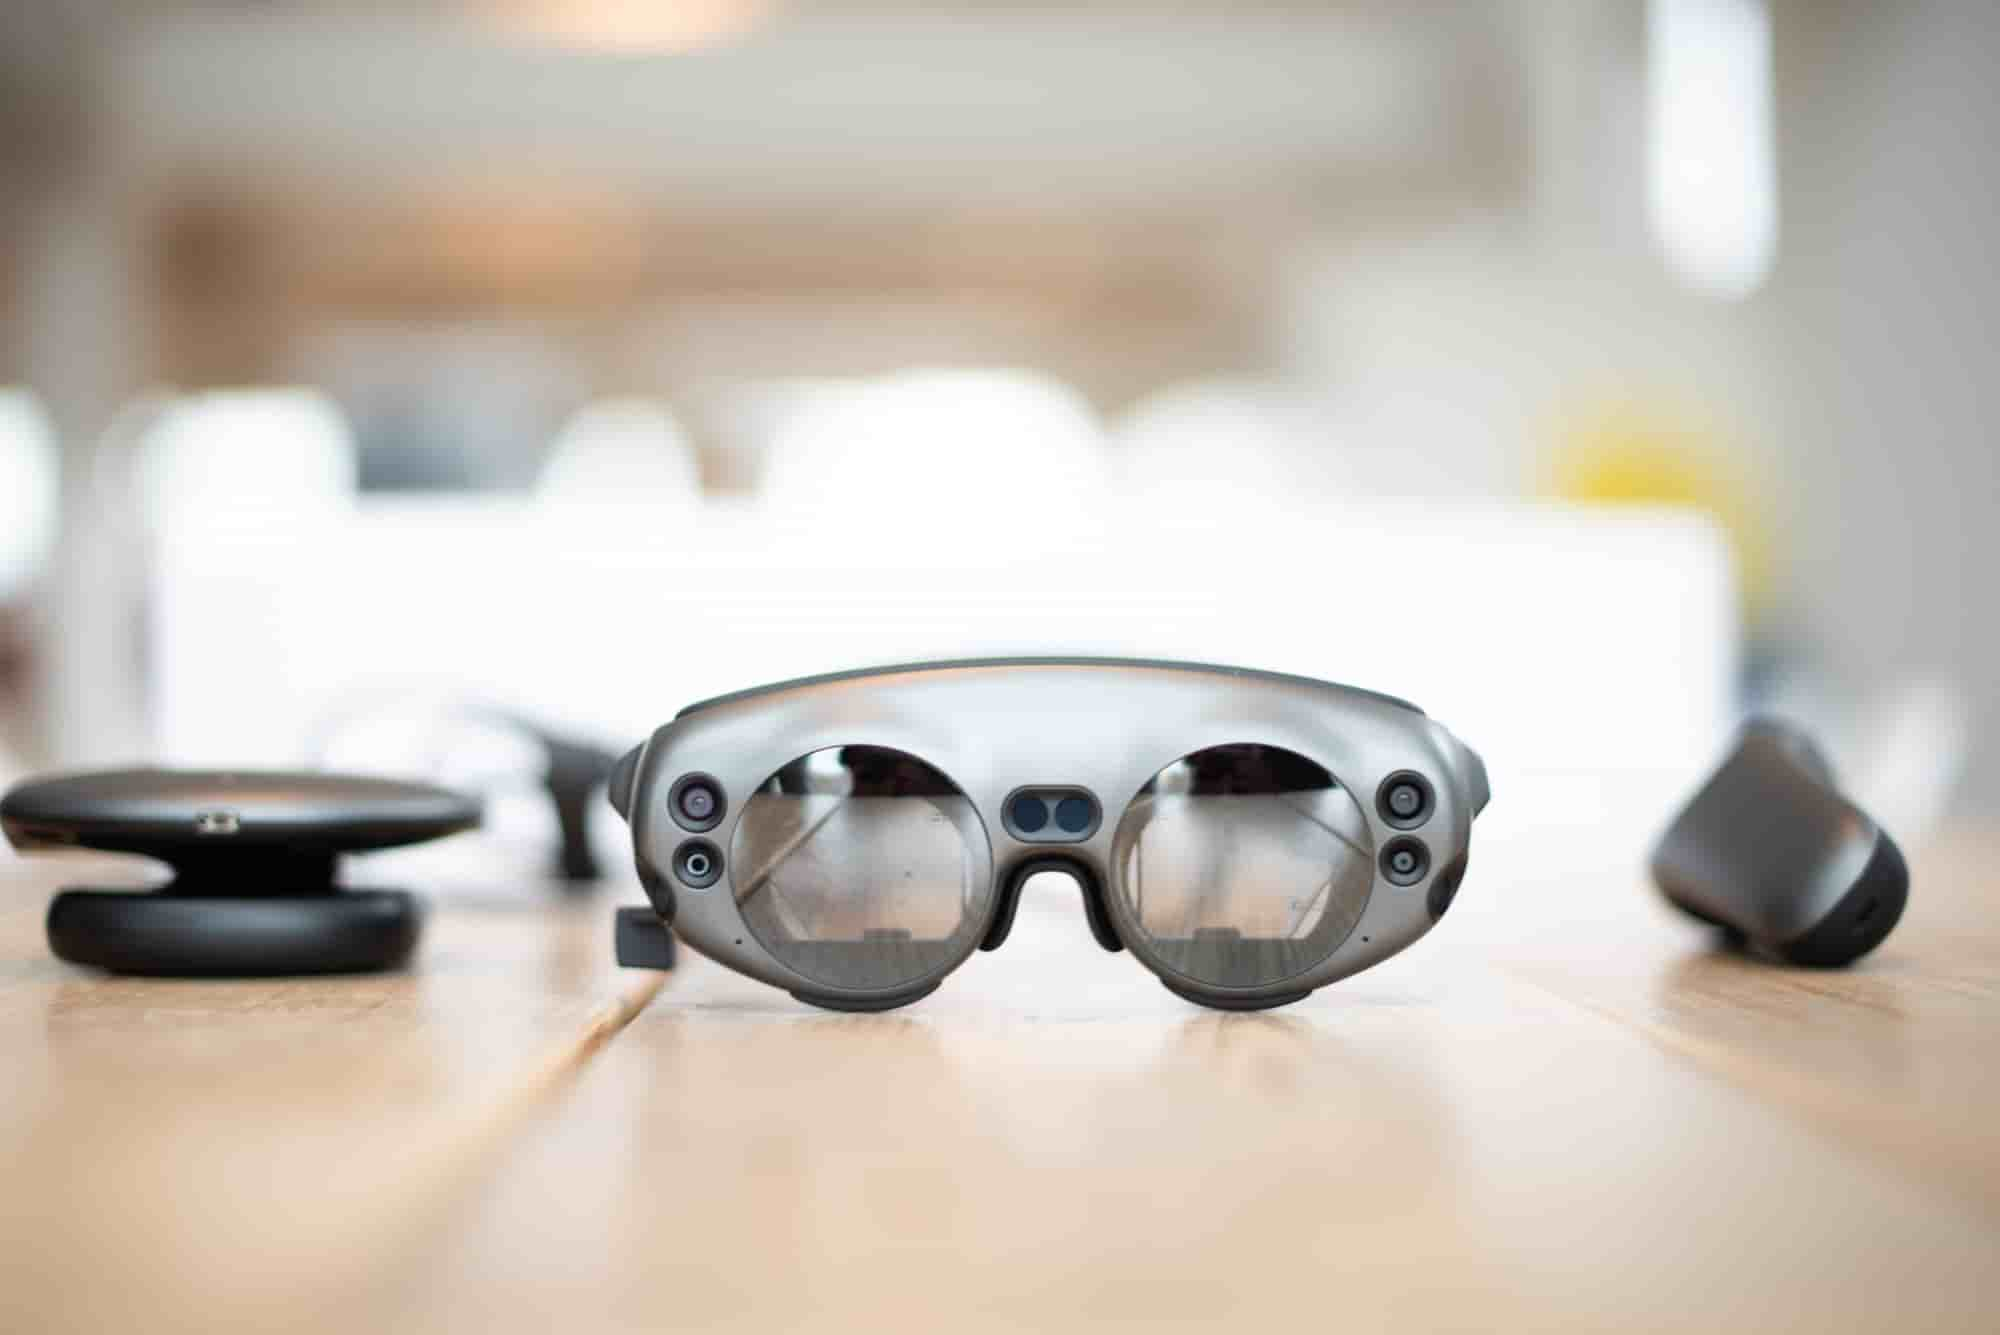
Meanwhile, there are strategies to accelerate that process and to build AR apps that align with consumer affinities. And these strategies will be a moving target as AR evolves from mobile – the predominant form factor today – to its real endgame: headworn. We will end this report with a data point that quantifies this early transition from handheld to headworn AR.


Price: $999

The fastest and most cost-efficient way to get access to this report is by subscribing to ARtillery PRO. You can also purchase it a la carte.


Companion Video


Methodology

ARtillery Intelligence has partnered with Thrive Analytics by writing the questions for the Virtual Reality Monitor consumer survey. These questions were fielded to more than 72,000 U.S. Adults. ARtillery Intelligence wrote this report, containing its insights and viewpoints on the survey results.

For market sizing and analysis, ARtillery Intelligence follows disciplined best practices, developed and reinforced through its principles’ 17 years in research and intelligence in the tech sector. This includes the past 7 years covering AR & VR exclusively, as seen in research and daily reporting.

Thrive Analytics likewise follows best practices in consumer research, developed over its long tenure as a consumer research firm. More details about the survey sample can be seen in this report’s introduction and more on ARtillery Intelligence research methodology can be read here.

More about ARtillery Intelligence’s market-sizing methodology can be seen here and more on its credentials can be seen here.

Disclosure & Ethics Statement

Unless specified in its stock ownership disclosures, ARtillery Intelligence has no financial stake in the companies mentioned in its reports. The production of this report likewise wasn’t commissioned. With all market sizing, ARtillery Intelligence remains independent of players and practitioners in the sectors it covers, thus mitigating bias in industry revenue calculations and projections. ARtillery Intelligence’s disclosures, stock ownership, and ethics policy can be seen in full here.


Purchase Report

Checkout easily and securely.


Questions

Ask us anything

Error: Contact form not found.


Reference

Credentials & context

Mobile AR Global Revenue Forecast: 2022-2027


Executive Summary

Like many research & intelligence firms, one of the things that ARtillery Intelligence does is market sizing. A few times per year, we go into isolation and bury ourselves deep in financial modeling. This takes the insights and observations we accumulate throughout the year and synthesizes them into hard numbers for the current and future spatial computing industry.

The latest such effort zeroes in on mobile AR, which is projected to grow from $15.1 billion in 2022 to $39.8 billion in 2027. In fact, mobile AR revenue today exceeds other XR sectors we track, such as headworn AR and VR, as it piggybacks on a global base of 3.6 billion smartphones.

But that installed base doesn’t always translate to revenue. For example, consumer spending in mobile AR is relatively low, including digital goods such as in-app purchases in Pokémon Go. Though the game is still going strong, it’s a bit of an outlier as most consumers aren’t otherwise paying for AR experiences. Those that do mostly execute in-app purchases – an established and comfort-advantaged behavior due to its firm footing in mobile gaming. Bottom line: consumers largely aren’t buying AR apps.

Consumers are however buying physical goods with the help of AR. This involves AR product visualization and try-ons that add more dimension and consumer confidence in eCommerce consideration phases. This has resonated with consumers – especially in the eCommerce-heavy Covid era when AR got the chance to shine – as well as brands and retailers. These entities have meaningfully adopted AR in their marketing, as it helps them to demonstrate products with greater detail and dimension.

This brand adoption represents an area of AR spending we classify as B2B2C. It involves brands that utilize AR to create experiences for their customers or marketing targets. Put another way – and synthesizing a few points made so far – most mobile AR usage today is brand sponsored rather than consumer purchased. This same B2B2C principle applies in other categories in this forecast, including AR media & games development, as well as commerce enablement.

Beyond B2B2C, there’s also B2B spending in AR. This mostly involves AR that helps industrial and corporate enterprises boost their effectiveness or productivity. For example, AR can help IT services companies empower their field reps to operate with greater speed and effectiveness through line-of-sight guidance and remote support. This enterprise productivity holds the most promise in headworn AR but today remains prevalent in mobile AR, due to smartphone ubiquity.

So how do all these principles translate to revenue? That’s what we’ll quantify and qualify throughout this report…


Price: $1999

The fastest and most cost-efficient way to get access to this report is by subscribing to ARtillery PRO (Startup tier or higher for forecast access). You can also purchase it a la carte.


Companion Video


Methodology

ARtillery Intelligence follows disciplined best practices in market sizing and forecasting, developed and reinforced through its principles’ 17 years in research and intelligence in tech sectors. This includes the past 7 years covering AR & VR as a primary focus.

This report focuses on mobile AR revenue projections in various sub-sectors and product areas. ARtillery Intelligence has built financial models that are customized to the specific dynamics and unit economics of each. These include variables like unit sales, company revenues, pricing trends, market trajectory and several other micro and macro factors that ARtillery Intelligence tracks.

This approach primarily applies a bottom-up forecasting methodology, which is secondarily vetted against a top-down analysis. Together, confidence is achieved through triangulating revenues and projections in a disciplined way. For more information on what’s included and not included in the forecast (a key consideration when evaluating the findings) see the next slide.

More about ARtillery Intelligence’s market-sizing methodology can be seen here and more on its credentials can be seen here.

Disclosure & Ethics Statement

Unless specified in its stock ownership disclosures, ARtillery Intelligence has no financial stake in the companies mentioned in its reports. The production of this report likewise wasn’t commissioned. With all market sizing, ARtillery Intelligence remains independent of players and practitioners in the sectors it covers, thus mitigating bias in industry revenue calculations and projections. ARtillery Intelligence’s disclosures, stock ownership, and ethics policy can be seen in full here.


Purchase Report

Checkout easily and securely.


Questions

Ask us anything

Error: Contact form not found.


Reference

Credentials & context

AR Marketing Best Practices & Case Studies, Volume 3


Executive Summary

Spatial computing continues to evolve and take shape as an industry. Like other tech sectors, it has spawned several sub-segments that comprise an ecosystem. These each represent standalone topics in ARtillery Intelligence’s ongoing analysis, including monthly intelligence briefings like this.

Prominent sectors so far include industrial AR, consumer VR, and AR shopping. But existing alongside all of them – and overlapping to some degree – is AR marketing. Among other things, this includes sponsored AR lenses that let consumers visualize or virtually try-on products.

Supporting AR marketing are several components. For example, lens creation software arms brands and developers with low-code tools to author AR experiences. Social networks like Snapchat and Instagram meanwhile offer the additional ability to amplify lenses throughout their social graphs. That paid amplification is projected to drive $4.4 billion in brand spending this year and $7.8 billion by 2026.

As we’ve examined in past reports, the factors driving this brand spending include advertisers’ growing affinity for, and recognition of, AR’s potential. Its ability to demonstrate products in immersive ways resonates with their creative sensibilities, transcending what’s possible in two-dimensional formats.

Beyond that appeal, there’s a real business case. AR marketing campaigns continue to show strong performance metrics. This was the case in “normal” times and accelerated during the Covid era when retail lockdowns compelled AR’s ability to visualize products remotely. That exposure has led to sustained traction in the Post-Covid era.

AR marketing’s proof can be seen in the numbers, such as campaign performance metrics analyzed in past case studies. We’re now doubling down on those narratives with another round of case studies.

The goal is to explore not only the what and why of AR marketing – well-worn topics – but also the how. This takes shape in AR campaign breakdowns. What’s working and not working in these early stages while the AR marketing playbook is still being written?

Another ongoing theme carried forward in this report is how AR marketing campaigns can map to brand marketers’ varied goals. This builds on AR’s versatility and its unique ability to span the consumer purchase funnel – from upper-funnel reach-driven campaigns to lower-funnel conversion-driven campaigns.

The case studies in this report will accordingly span funnel stages. Similarly, we’ll examine varied and evolving analytics. In fact, a looming question in AR marketing is what are the best metrics to track effectiveness? This will be a moving target.

As a bonus, ARtillery Intelligence has created a library of AR ad campaigns. Known as Campaign Tracker, it lives on ARtillery Pro (login required). It includes AR ad campaigns at-a-glance and in-depth. It’s meant to supplement this report with ongoing all-year education around AR marketing best practices. As always, the goal is to empower you with a knowledge edge.


Price: $999

The fastest and most cost-efficient way to get access to this report is by subscribing to ARtillery PRO. You can also purchase it a la carte.


Companion Video


Methodology

This report highlights ARtillery Intelligence viewpoints, gathered from its daily in-depth market coverage. To support narratives, data are cited throughout the report. These include ARtillery Intelligence’s original data, as well as that of third parties. Sources are linked or attributed in each case.

For market sizing and forecasting, ARtillery Intelligence follows disciplined best practices, developed and reinforced through its principles’ 17 years in tech-sector research and intelligence. This includes the past 7 years covering AR & VR exclusively, as seen in research reports and daily reporting.

This approach primarily applies a bottom-up forecasting analysis, secondarily vetted against a top-down analysis. Together, confidence is achieved through triangulating figures in a disciplined way. More about our methodology can be seen here, and market-sizing credentials can be seen here.

Disclosure & Ethics Statement

Unless specified in its stock ownership disclosures, ARtillery Intelligence has no financial stake in the companies mentioned in its reports. The production of this report likewise wasn’t commissioned. With all market sizing, ARtillery Intelligence remains independent of players and practitioners in the sectors it covers, thus mitigating bias in industry revenue calculations and projections. ARtillery Intelligence’s disclosures, stock ownership, and ethics policy can be seen in full here.


Purchase Report

Checkout easily and securely.


Questions

Ask us anything

Error: Contact form not found.


Reference

Credentials & context

XR Global Revenue Forecast 2021-2026


Executive Summary


Like many research & intelligence firms, one of the things that ARtillery Intelligence does is market sizing. A few times per year, we go into isolation and bury ourselves deep in financial modeling. This takes the insights and observations we accumulate throughout the year and synthesizes them into hard numbers for the current and future spatial computing industry (methodology details below).

Our latest forecasting endeavor covers the spatial spectrum, otherwise known as XR. Spanning AR (mobile & headworn) and VR, this forecast takes a holistic view of hardware, software, and supporting tech, including consumer and enterprise deployments. A departure from the deep-dive individual forecasts in these XR subsectors, this annual forecasting exercise combines them for a more holistic view of the market opportunity for spatial computing.

So what did the forecast uncover? Starting at the top, the high-level revenue comparison between AR (headworn and mobile) and VR reveals their respective penetration levels and lifecycle stages. Mobile AR leads the pack with $13.5 billion in revenue this year, followed by VR ($11.9 billion) and headworn AR ($3.8 billion). Here, mobile AR’s lead is owed to piggybacking on an installed base of 3 billion+ smartphones.

But that installed base doesn’t always translate to revenue. For example, consumer spending in mobile AR is relatively low. Most of that spending is for digital goods, such as in-app purchases in Pokémon Go. Though the game is still going strong, it’s a bit of an outlier as most consumers aren’t paying for AR experiences. Those that do mostly execute in-app purchases – an established and comfort-advantaged behavior thanks to the wide world of mobile gaming. Bottom line: consumers largely aren’t buying AR apps.

So if not consumers, where is money being made in mobile AR. The short answer is B2B2C. This involves brand spending to create AR experiences for their customers or marketing targets. It includes AR marketing, commerce and experience creation. Put another way, most mobile AR usage and activity is brand sponsored. And that B2B2B principle transcends mobile AR. We see the same in VR and headworn AR, including developer tools and other enabling tech.

Speaking of VR, it’s a segment where most revenue comes from consumers. The big story there continues to be Meta’s loss-leader investments to gain early market share and build a network effect for their vision of the future connected web. Though we won’t spend much time in this report invoking the m-word, the metaverse should be mentioned here as Meta’s motivation for all this investment. See our State of Spatial Computing report for more depth on that topic.

As for headworn AR, most spending today is from enterprises, as AR glasses aren’t consumer-ready. That statement applies on both technological and cultural levels. But we’re gradually getting there through the work of tech giants like Google, Meta; and enablers like Qualcomm and Niantic. But the main story in AR glasses is continued speculation around what Apple may do. All eyes are on the Cupertino market maker due to its track record in mainstreaming emerging tech through its signature halo effect. It could make or break AR.

So how do all these principles translate to revenue? That’s what we’ll quantify and qualify throughout this report.


Price: $1999

The fastest and most cost-efficient way to get access to this report is by subscribing to ARtillery PRO (Startup tier or greater for forecast access). You can also purchase it a la carte.


What’s Covered


Methodology

ARtillery Intelligence follows disciplined best practices in market sizing and forecasting, developed and reinforced through its principles’ 17 years in research and intelligence in tech sectors. This includes the past 7 years covering AR & VR as a primary focus.

This report focuses on XR revenue projections in various sub-sectors and product areas. ARtillery Intelligence has built financial models that are customized to the specific dynamics and unit economics of each. These include variables like unit sales, company revenues, pricing trends, market trajectory and several other micro and macro factors that ARtillery Intelligence tracks.

This approach primarily applies a bottom-up forecasting methodology, which is secondarily vetted against a top-down analysis. Together, confidence is achieved through triangulating revenues and projections in a disciplined way. For more information on what’s included and not included in the forecast (a key consideration when evaluating the findings) see the next slide.

More about ARtillery Intelligence’s market-sizing methodology can be seen here and more on its credentials can be seen here.

Disclosure & Ethics Statement

Unless specified in its stock ownership disclosures, ARtillery Intelligence has no financial stake in the companies mentioned in its reports. The production of this report likewise wasn’t commissioned. With all market sizing, ARtillery Intelligence remains independent of players and practitioners in the sectors it covers, thus mitigating bias in industry revenue calculations and projections. ARtillery Intelligence’s disclosures, stock ownership and ethics policy can be seen in full here.


Purchase Report

Checkout easily and securely.


Questions

Ask us anything

Error: Contact form not found.


Reference

Credentials & context

Reality Check: The State of Spatial Computing


Executive Summary

Spatial computing – including AR, VR, and other immersive tech – continues to alter the ways that we work, play, and live. But there have been ups and downs, characteristic of hype cycles. The pendulum has swung towards over-investment, then towards market correction – leaving us now in a middle ground of reset expectations and moderate growth.

Beyond that macro view, the spatial spectrum holds greater nuance in the varied growth curves of its subsectors. Those seeing the most traction include AR brand marketing and consumer VR. Meta continues to advance the latter with massive investments, loss-leader pricing, and new hardware launched this year.

Driving this investment is Meta’s vision for the metaverse. Disproving our prediction last year, “metaverse mania” hasn’t receded… In fact, it has gained steam. “Steam” is perhaps the right term, as the metaverse continues to be mostly vapor. It has immense potential as an interconnected 3D web… but is currently more about unfocused punditry than real products.

Stepping back, what is the metaverse? By some definitions, you’re in the internet instead of on the internet. This manifests in 3D virtual spaces that host time-synchronized interaction between place-shifted participants. Today’s metaverse-like fiefdoms include multiplayer games like Fortnite and Roblox. They’re not THE Metaverse (uppercase M), because they exist as silos that aren’t interoperable.

But it’s not just about 3D gaming. Beyond the common metaverse connotation for online 3D experiences, there’s a second track. We’re talking about a potential physical-world metaverse. The idea is that geo-anchored data can trigger devices to evoke digital content, including AR, where and when it’s relevant.

This metavearth as we call it is built on a multi-dimensional data mesh – sort of like Google’s search index but for the physical world. This metaverse track is potentially more valuable than its online 3D counterpart. It’s also truer to the Greek root meta, which means “beyond.” We’re talking about digital content that evokes meaning beyond a given entity’s physical state.

But enough about the metaverse. While its theoretical endpoints are pursued, its building blocks are creating standalone value today. That brings us back to VR and AR, which happen to map to these online and “real-world” metaverse tracks. With both technologies, we continue to see traction and value through the work of Snap, Meta, Google, and others.

Beyond user-facing products, a spatial tech stack lies beneath. This involves a cast of supporting parts. We’re talking processing muscle (Qualcomm), experience creation (Adobe), and developer platforms (Niantic). These are the engines of AR and VR growth.

So how is all of this coming together? Where are we in spatial computing’s lifecycle? And where are there gaps in the value chain that signal opportunity for AR and VR players? We dive into these questions and others through numbers and narratives. The goal, as always, is to empower you with a knowledge edge.


Price: $999

The fastest and most cost-efficient way to get access to this report is by subscribing to ARtillery PRO. You can also purchase it a la carte.


Companion Video


Methodology

This report highlights ARtillery Intelligence viewpoints, gathered from its daily in-depth market coverage. To support narratives, data are cited throughout the report. These include ARtillery Intelligence’s original data, as well as that of third parties. Sources are linked or attributed in each case.

For market sizing and forecasting, ARtillery Intelligence follows disciplined best practices, developed and reinforced through its principles’ 17 years in tech-sector research and intelligence. This includes the past 7 years covering AR & VR exclusively, as seen in research reports and daily reporting.

This approach primarily applies a bottom-up forecasting analysis, secondarily vetted against a top-down analysis. Together, confidence is achieved through triangulating figures in a disciplined way. More about our methodology can be seen here, and market-sizing credentials can be seen here.

Disclosure & Ethics Statement

Unless specified in its stock ownership disclosures, ARtillery Intelligence has no financial stake in the companies mentioned in its reports. The production of this report likewise wasn’t commissioned. With all market sizing, ARtillery Intelligence remains independent of players and practitioners in the sectors it covers, thus mitigating bias in industry revenue calculations and projections. ARtillery Intelligence’s disclosures, stock ownership, and ethics policy can be seen in full here.


Purchase Report

Checkout easily and securely.


Questions

Ask us anything

Error: Contact form not found.


Reference

Credentials & context

VR Global Revenue Forecast, 2021-2026


Executive Summary

Like many research & intelligence firms, one of the things that ARtillery Intelligence does is market sizing. A few times per year, we go into isolation and bury ourselves deep in financial modeling. This takes the insights and observations we accumulate throughout the year and synthesizes them into hard numbers for the current and future spatial computing industry.

In covering spatial computing for seven years, our sector knowledge base and perspective continue to expand. That occurs on several levels, including insight and access to insider information, all of which informs our forecast models and inputs. Further reinforcing that knowledge position, the daily rigors of editorial production at our sister publication AR Insider emboldens our market insights.

Beyond a knowledge position and market-sizing process, the focus of these forecasts likewise continues to evolve. Our first market forecast six years ago examined AR, VR and all their revenue subsegments. More recently, we began to produce separate forecasts for AR and VR. Though they share technical underpinnings, their nuanced market dynamics deserve deeper and focused treatment.

We continue to double down on that segmentation by focusing this report on VR specifically. Given its unique dynamics – in both technology and user adoption patterns – it compels its own focused analysis. This allows us to go deeper on key revenue sources like consumer, corporate & industrial, and VR-enablement software. We did the same earlier this year for mobile AR and headworn AR.

So what did we find out? Our outlook continues to be best characterized as cautiously optimistic, especially when compared to several large research firms that turn attention to VR occasionally to publish eyepopping revenue estimates in the hundreds of billions of dollars. By comparison, we’re comfortably and confidently in the tens-of-billions range for aggregate VR spending in outer years of this financial outlook.

The question is how VR is materializing today. How are revenues trending? Which subsectors are most opportune? How will Meta’s ongoing investments accelerate the sector? And how will VR fare in the post-Covid era? We tackle these questions through numbers & narratives.


Price: $1999

The fastest and most cost-efficient way to get access to this forecast is by subscribing to ARtillery PRO (Startup tier or greater for forecast access). You can also purchase it a la carte.


Companion Video


What’s Covered


Methodology

ARtillery Intelligence follows disciplined best practices in market sizing and forecasting, developed and reinforced through its principles’ 17 years in research and intelligence in tech sectors. This includes the past 7 years covering AR & VR as a primary focus.

This report focuses on V–R revenue projections in various sub-sectors and product areas. ARtillery Intelligence has built financial models that are customized to the specific dynamics and unit economics of each. These include variables like unit sales, company revenues, pricing trends, market trajectory and several other micro and macro factors that ARtillery Intelligence tracks.

This approach primarily applies a bottom-up forecasting methodology, which is secondarily vetted against a top-down analysis. Together, confidence is achieved through triangulating revenues and projections in a disciplined way. For more information on what’s included and not included in the forecast (a key consideration when evaluating the findings) see the next slide.

More about ARtillery Intelligence’s market-sizing methodology can be seen here and more on its credentials can be seen here.

Disclosure & Ethics Statement

Unless specified in its stock ownership disclosures, ARtillery Intelligence has no financial stake in the companies mentioned in its reports. The production of this report likewise wasn’t commissioned. With all market sizing, ARtillery Intelligence remains independent of players and practitioners in the sectors it covers, thus mitigating bias in industry revenue calculations and projections. ARtillery Intelligence’s disclosures, stock ownership and ethics policy can be seen in full here.


Purchase Report

Checkout easily and securely.


Questions

Ask us anything

Error: Contact form not found.


Reference

Credentials & context

Visual Search: Augmented Reality’s Killer App?


Executive Summary

AR comes in many flavors. This is true of any technology in early stages as it twists around and takes shape. The most prevalent format so far is social lenses, as they enhance and adorn sharable media . Line-of-sight guidance in industrial settings is also proving valuable .

But a less-discussed AR modality is visual search. Led by Google Lens and Snap Scan, this lets users point their smartphone cameras (or future glasses) at real-world objects to identify them. It can contextualize things in the real world with informational overlays… or what we call “captions for the real world.”

This flips the script from other forms of AR in that it identifies unknown items rather than displaying known ones. As such, the potential use cases are greater – transcending pre-ordained experiences that can have relatively narrow utility. Visual search has the extent of the physical world as its canvas.

For example, use cases include education, travel, and shopping. Students can identify landmarks, while travelers discover and navigate new locales. Socialites can discover new bars & restaurants. And fashion acolytes can identify apparel they encounter IRL.

Notably, these are high-frequency activities. In that sense, like web search, visual search’s utility could emerge throughout a given user’s day. This engenders stickiness and repeat use… which can’t always be said for AR lenses whose value lies in novelty or whimsy.

Beyond utility and range, visual search’s value stems from a factor that makes web search so valuable: intent. The lean-forward act of identifying objects visually can signal high buying intent when done in commercial contexts such as fashion and food discovery.

These are all reasons Google is so keen on visual search. Along with voice search, it could help the search giant future proof its core business. This is amplified by gen-Z’s affinity for the camera, and its spending power as it phases into the adult consumer population.

To that end, Google continues to invest in developing and accelerating visual search. For example, a Google Lens button now sits prominently next to the search bar on Google’s mobile interface – prime real estate to drive exposure and adoption.

Google meanwhile has an inside track. As the world’s search engine for 20+ years, it has a knowledge graph and image database to fuel AI training sets for object recognition. Snap is also primed for narrower, but still high-value, use cases like fashion and food discovery.

But though all the above adds up on theoretical levels, there are barriers in practice. These include computational challenges as well as behavioral and cultural impediments. Though visual search is compelling, it deviates from deep-rooted consumer habits.

So how will it develop in the coming months and years? Who are the players? And how big could it get? We set out in this report to answer such questions through numbers and narratives. The goal, as always, is to empower ARtillery Intelligence clients and Pro subscribers with a knowledge edge.

Price: $999

The fastest and most cost-efficient way to get access to this report is by subscribing to ARtillery PRO. You can also purchase it a la carte.


Companion Video


Methodology

This report highlights ARtillery Intelligence’s viewpoints, gathered from its daily in-depth coverage of spatial computing. To support the narrative, data are cited throughout the report. These include ARtillery Intelligence’s original data, as well as that of third parties. Data sources are attributed in each case.

For market sizing and forecasting, ARtillery Intelligence follows disciplined best practices, developed and reinforced through its principles’ 15 years in tech sector research and intelligence. This includes the past 4 years covering AR & VR exclusively, as seen in research reports and daily reporting.

Furthermore, devising these figures involves the “bottom-up” market-sizing methodology, which involves granular ad revenue dynamics such as campaign pricing and spending. More about ARtillery Intelligence methodology can be seen here, and market-sizing credentials can be seen here.

Disclosure & Ethics Statement

Unless specified in its stock ownership disclosures, ARtillery Intelligence has no financial stake in the companies mentioned in its reports. The production of this report likewise wasn’t commissioned. With all market sizing, ARtillery Intelligence remains independent of players and practitioners in the sectors it covers, thus mitigating bias in industry revenue calculations and projections. ARtillery Intelligence’s disclosures, stock ownership and ethics policy can be seen in full here.


Purchase Report

Checkout easily and securely.


Questions

Ask us anything

Error: Contact form not found.


Reference

Credentials & context

The Camera Company: Lessons from Snap’s AR Lead


Executive Summary

Though AR hasn’t demonstrated the world-changing capabilities that were touted in the technology’s circa-2017 hype cycle, it’s finding success in specific areas. Those include enterprise productivity and brand marketing, both of which were examined in recent ARtillery Intelligence reports like this one.

Zeroing in on the latter, one company leading the way in providing ¬– and generating meaningful revenue from – AR marketing is Snap. Congruent with its self-designated “camera-company” moniker, it has made an early commitment to social AR lenses and continues to double down on the technology.

This plays out in a few ways. It all starts with seeding consumer demand and cultivating behavior through interactive lenses. They enhance already-popular activities such as media sharing, selfies, and status updates. Snap first did this with lenses that it created in-house – including whimsical selfie adornments such as dog ears and rainbow vomit.

Seeing the success of those AR lenses, Snap was emboldened to take AR to the next level: a creator platform. Lens Studio was born to scale up AR development and broaden its use cases through the crowd-sourced creativity of far-flung designers and developers. Snap continues to attract them through an ever-broadening set of features for creating, promoting, and monetizing lenses.

The resulting scale and innovation achieved through Lens Studio have driven even greater lens usage. That user demand in turn attracts more exposure-driven lens creators. This virtuous cycle has brought Snap to the lens-leading position it enjoys today, including 6 billion daily lens engagements. This is the equivalent of one lens engagement for every human on earth, per day – exceeding any other consumer AR product. Snap also boasts 250 million daily active lens users, which is about 75 percent of its overall users.

All the above has led to the real endgame for Snap: ad revenue. Brand advertisers continue to be attracted to the scale that Snap has achieved with its AR lenses. Beyond sheer reach, brand marketers are drawn to AR’s creative capacity to demonstrate products with greater dimension. And campaign case studies continue to validate AR marketing’s efficacy and performance versus 2D benchmarks.

But beyond Snap’s historical evolution and the flywheel effect that drives the aforementioned “virtuous cycle,” what are lessons and strategic takeaways? What is Snap doing right in terms of platform commitment, investment, innovation and execution? How has it built an AR-first company culture? And how does all the above prime Snap for AR’s next era: smart glasses?

We set out in this report to answer such questions through a deep look at Snap’s past, present, and future. We’ve talked to Snap executives and spent the past few years tracking its AR evolution. We’ll synthesize that analysis in the coming pages through numbers and narratives.

The goal, as always, is to empower ARtillery Intelligence clients and Pro subscribers with a knowledge edge.

Price: $999

The fastest and most cost-efficient way to get access to this report is by subscribing to ARtillery PRO. You can also purchase it a la carte.


Companion Video


Methodology

This report highlights ARtillery Intelligence’s viewpoints, gathered from its daily in-depth coverage of spatial computing. To support the narrative, data are cited throughout the report. These include ARtillery Intelligence’s original data, as well as that of third parties. Data sources are attributed in each case.

For market sizing and forecasting, ARtillery Intelligence follows disciplined best practices, developed and reinforced through its principles’ 15 years in tech sector research and intelligence. This includes the past 4 years covering AR & VR exclusively, as seen in research reports and daily reporting.

Furthermore, devising these figures involves the “bottom-up” market-sizing methodology, which involves granular ad revenue dynamics such as campaign pricing and spending. More about ARtillery Intelligence methodology can be seen here, and market-sizing credentials can be seen here.

Disclosure & Ethics Statement

Unless specified in its stock ownership disclosures, ARtillery Intelligence has no financial stake in the companies mentioned in its reports. The production of this report likewise wasn’t commissioned. With all market sizing, ARtillery Intelligence remains independent of players and practitioners in the sectors it covers, thus mitigating bias in industry revenue calculations and projections. ARtillery Intelligence’s disclosures, stock ownership and ethics policy can be seen in full here.


Purchase Report

Checkout easily and securely.


Questions

Ask us anything

Error: Contact form not found.


Reference

Credentials & context