Metaverse Reality Check: The What, When & Where


If there’s one term that’s reverberated throughout AR and VR circles more than any other in 2021, it’s metaverse. Though it represents legitimate principles, the word itself has become co-opted and conflated through overuse… as it often goes with buzzwords.
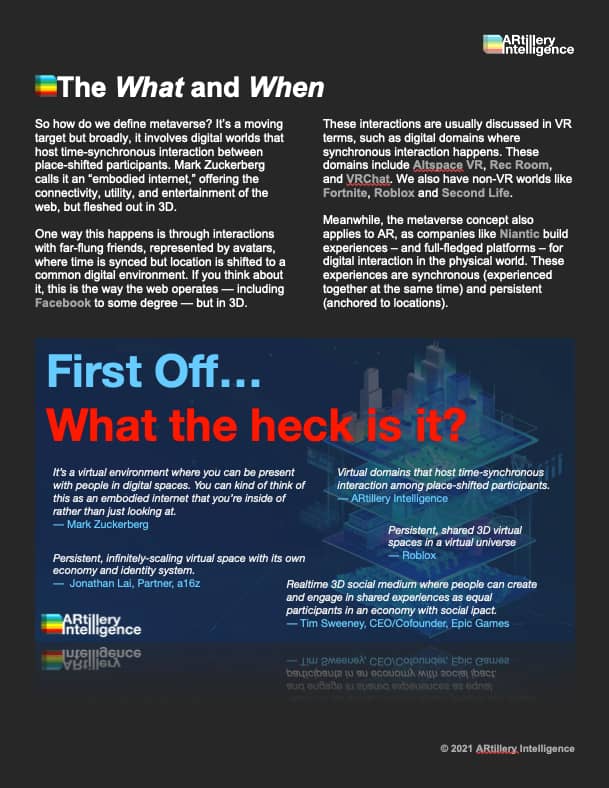
In broad terms, ‘metaverse’ defines digital worlds that host synchronous human interaction. Mark Zuckerberg – intent on making Facebook a metaverse company – describes it as an “embodied internet,” offering the connectivity, utility, and entertainment of the web, but fleshed out in 3D.
This is usually discussed in VR terms, such as digital domains that host synchronous interaction between place-shifted participants. Today, these include Altspace VR, Rec Room, and VRChat. We also have non-VR worlds like Fortnite, Roblox and (much earlier) Second Life. But these are collectively missing one key metaverse property: interoperability.
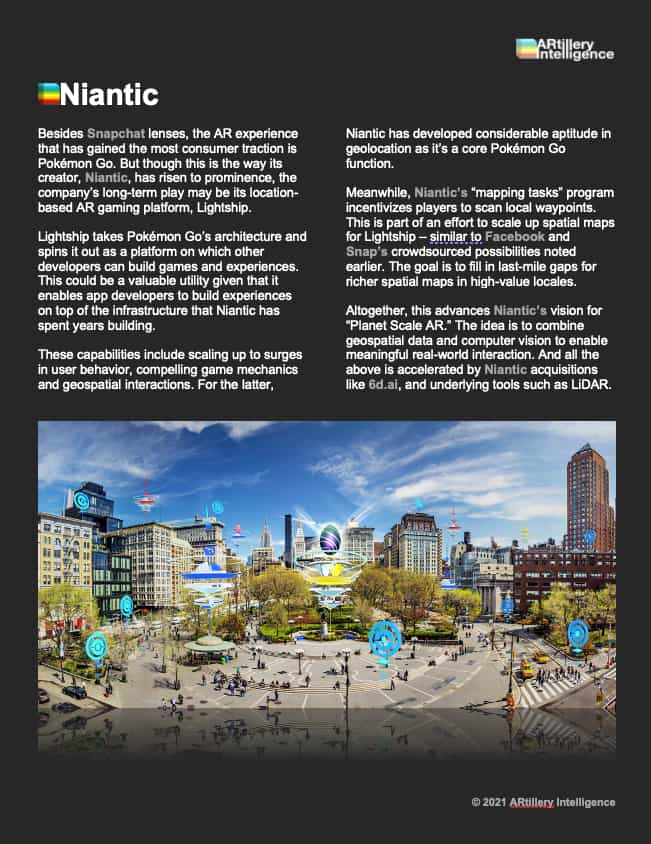
Meanwhile, the metaverse concept also applies to AR, as companies like Niantic build experiences and platforms for digital interaction with a physical world. These experiences are synchronous (experienced together at the same time) and persistent (anchored to locations). This metavearth was the topic of last month’s ARtillery Intelligence briefing.
Meanwhile, metaverse components and building blocks are being developed today. That will include a sort of metaverse stack, with access hardware, creation tools, 5G connectivity, sensory inputs, payment networks and identity protocols. These are each at early stages and need time to evolve and converge.
Even the metaverse’s use cases are unknown, though everyone likes to speculate. Novel use cases often aren’t devised until new platforms seep into the developer mindset. Apps like Uber – utilizing the mobile form factor and 4G – weren’t imagined when these enabling technologies were first devised or launched.
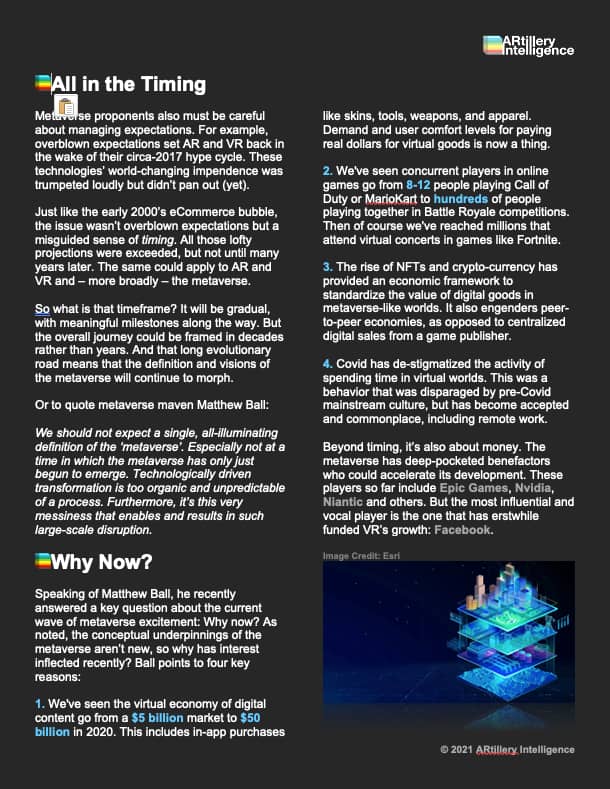
For that reason, we should be realistic about the metaverse’s timing. Its fully-actualized form – involving interoperable networks and devices – is likely years or even decades away. This qualifier rarely makes its way into metaverse musings that dominate tech headlines today.
In fact, if the VR and AR sectors should have learned anything in the circa-2017 hype cycle, it’s to not overpromise and underdeliver. That has set these industries back in terms of public sentiment and trust. The same dynamics will apply to the metaverse and its hype cycle.
Moreover, the metaverse requires a dose of caution in how it’s constructed. Given the immersive levels of user interaction and biometric tracking of an “embodied internet” nefarious intent could run rampant. And a new interactive paradigm provides opportunity to fix things that are sub-optimal on today’s 2D web.
But how will all of this come together? How will economies develop in the metaverse? What are the missing pieces? And what lessons does today’s web teach us? We’ll tackle these questions throughout this report in our own analysis and that of top minds we’ve assembled to weigh in. The goal, as always, is to empower you with a knowledge edge.

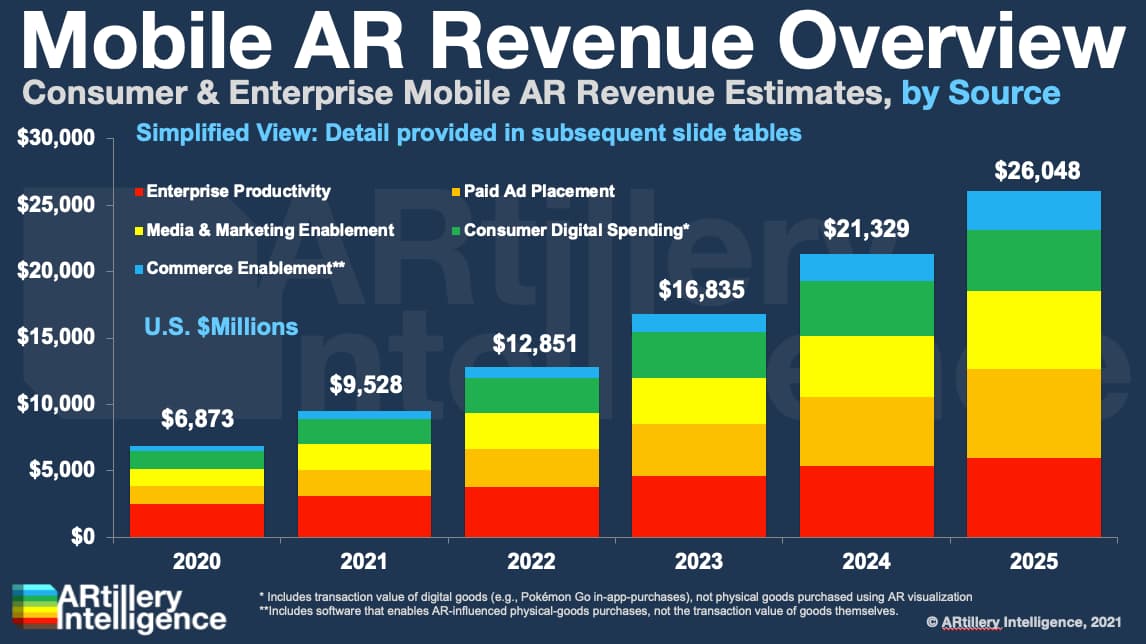
This report highlights ARtillery Intelligence’s viewpoints, gathered from its daily in-depth coverage of spatial computing. To support the narrative, data are cited throughout the report. These include ARtillery Intelligence’s original data, as well as that of third parties. Data sources are attributed in each case.
For market sizing and forecasting, ARtillery Intelligence follows disciplined best practices, developed and reinforced through its principles’ 15 years in tech sector research and intelligence. This includes the past 4 years covering AR & VR exclusively, as seen in research reports and daily reporting.
Furthermore, devising these figures involves the “bottom-up” market-sizing methodology, which involves granular ad revenue dynamics such as campaign pricing and spending. More about ARtillery Intelligence methodology can be seen here, and market-sizing credentials can be seen here.


Unless specified in its stock ownership disclosures, ARtillery Intelligence has no financial stake in the companies mentioned in its reports. The production of this report likewise wasn’t commissioned. With all market sizing, ARtillery Intelligence remains independent of players and practitioners in the sectors it covers, thus mitigating bias in industry revenue calculations and projections. ARtillery Intelligence’s disclosures, stock ownership and ethics policy can be seen in full here.
Checkout easily and securely.
Editor’s note: While most ARtillery Intelligence reports are available for individual purchase, this report is available exclusively for ARtillery Pro subscribers. Sign up here.

Ask us anything
Credentials & context